| ← All communiqués |
|
||
|
2 March 2007
Markets Go Through Cycles |
||
|
Markets go through cycles. This may seem obvious but every few years market sentiment finds itself in a space where the direction of the stock market is so overwhelmingly obvious (and secure) that various market pundits start questioning why you should give your money to active managers and not just leave it in an index or tracker and enjoy the inevitable march upwards. Take the last few months. Following on from the tremendous bull market following the market lows of 2003, the JSE has made highs on virtually a daily basis. A strategy of buying the dips has worked famously and a strategy of buying the most hyped areas: infrastructure and the domestic consumer, has worked even better. Then, we endure a small correction over the past few days with the JSE losing 6% in three days and the Dow Jones Industrial giving up all its gains of 2007. Given the lack of down days on global markets for the past few years nobody would argue that a correction of sorts is not long overdue. In fact, until Tuesday (when it took a 3.5% smack) the S&P 500 had not had a 2% down day since 2003! The current rally on US stock markets is the third longest on record without a 10% correction. Maybe something has changed or maybe the market is forgetting that equities are risky assets. Judging by the excitement concerning the market decline over the past few days I am starting to suspect that people have forgotten that equities can and do go down. When the market cracked on Tuesday, financial journalists, as they do, started scrambling for the reasons for the fall. They singled out a precipitous drop on the Chinese stock market, triggered by remarks by Alan Greenspan that a recession in the US before the year was out was possible, as well as rumours of measures by Chinese authorities to curb extreme speculation. Never mind that the Shanghai index is still up over 30% on the year (even after the drop). Frankly, the reasons for the sell-off are irrelevant. We find ourselves in a situation where speculation in risky assets is heightened, investors are complacent and valuations are excessive. After such a strong run in the prices of financial assets, coinciding with very low levels of volatility and very high levels of liquidity, it is to be expected that we begin to endure some soul searching as to the sustainability of the bull market. This is particularly the case when the US economy starts to show some clear signs of slowing down. Remember if you will that the US economy, driven by the free spending US consumer, has been the engine room for global growth for the past few decades, and that the handing over of the baton to the up and coming tigers in the East is unlikely to be a seamless transition. But, I hear you clamouring, the fundamentals for South Africa are so positive. Surely, our stock market can only go up if we are going to spend R400 billion on infrastructure, host a World Cup and invest plenty more in manufacturing capacity, creating hundreds of thousands of jobs along the way, all the while running a budget surplus, and backed up by very healthy (and growing) levels of spending by domestic consumers. All of this is true and makes us positive about the long term outlook for economy and its stock market, but is it possible that the JSE is reflecting some of this good news? Let's have a look at the numbers. The JSE is on a PE (price-to-earnings ratio) of 15.3, down from recent levels of 17.6 after strong earnings numbers and a drop in market levels - refer Chart 1. This remains one standard deviation above the long term mean (of 11.65). Not a panic situation considering the low levels of bond yields (relative to earnings yields), but still pretty high, particularly if you consider that rates of earnings growth have peaked. The problem with using PE ratios as a measure of the overall values on the market is that the accountants tend to change the rules for the calculation of earnings from time to time and different time periods and companies are often not strictly comparable. We prefer to look at dividend yields as a measure of valuation. After all, the dividend paid reflects cash profitability and comfort that management have in the sustainability of such profits. Despite a general lowering of dividend covers over the past few years on the back of excellent cash conversion and lower levels of gearing, the dividend yield on the JSE finds itself at a paltry 2.2% - refer Chart 2. If you bought the JSE at similar levels in the past the best you could hope for was a year or two of more pedestrian (generally more volatile returns). Given the healthy outlook for corporate profitability our base case leans towards a consolidation phase where earnings growth unwinds some of the good news priced into the market. Higher volatility is likely after a time when everything has looked so positive and the market has moved up as a result. Chart 1 - PE ratio of the JSE (I-Net): 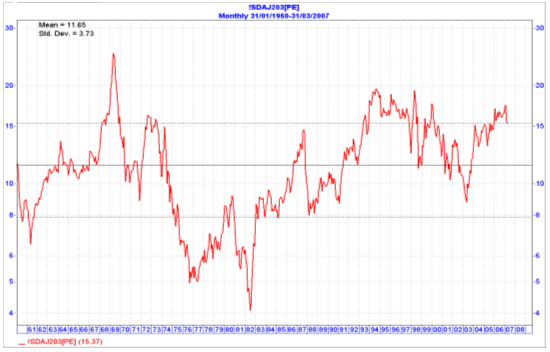
Chart 2 - Divident yield on the JSE (I-Net): 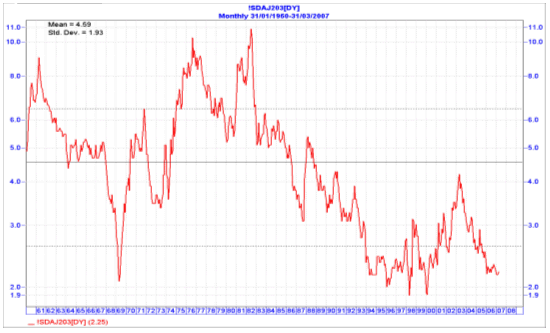
Source: Mark le Roux: Alphen Asset Management |



Editor: Shane Thom, Silke Financial Services FSP No. 12462 · An Authorised Financial Services Provider Copyright © 2007 by Silke Financial Services CC – All Rights Reserved. |